1
Uptime
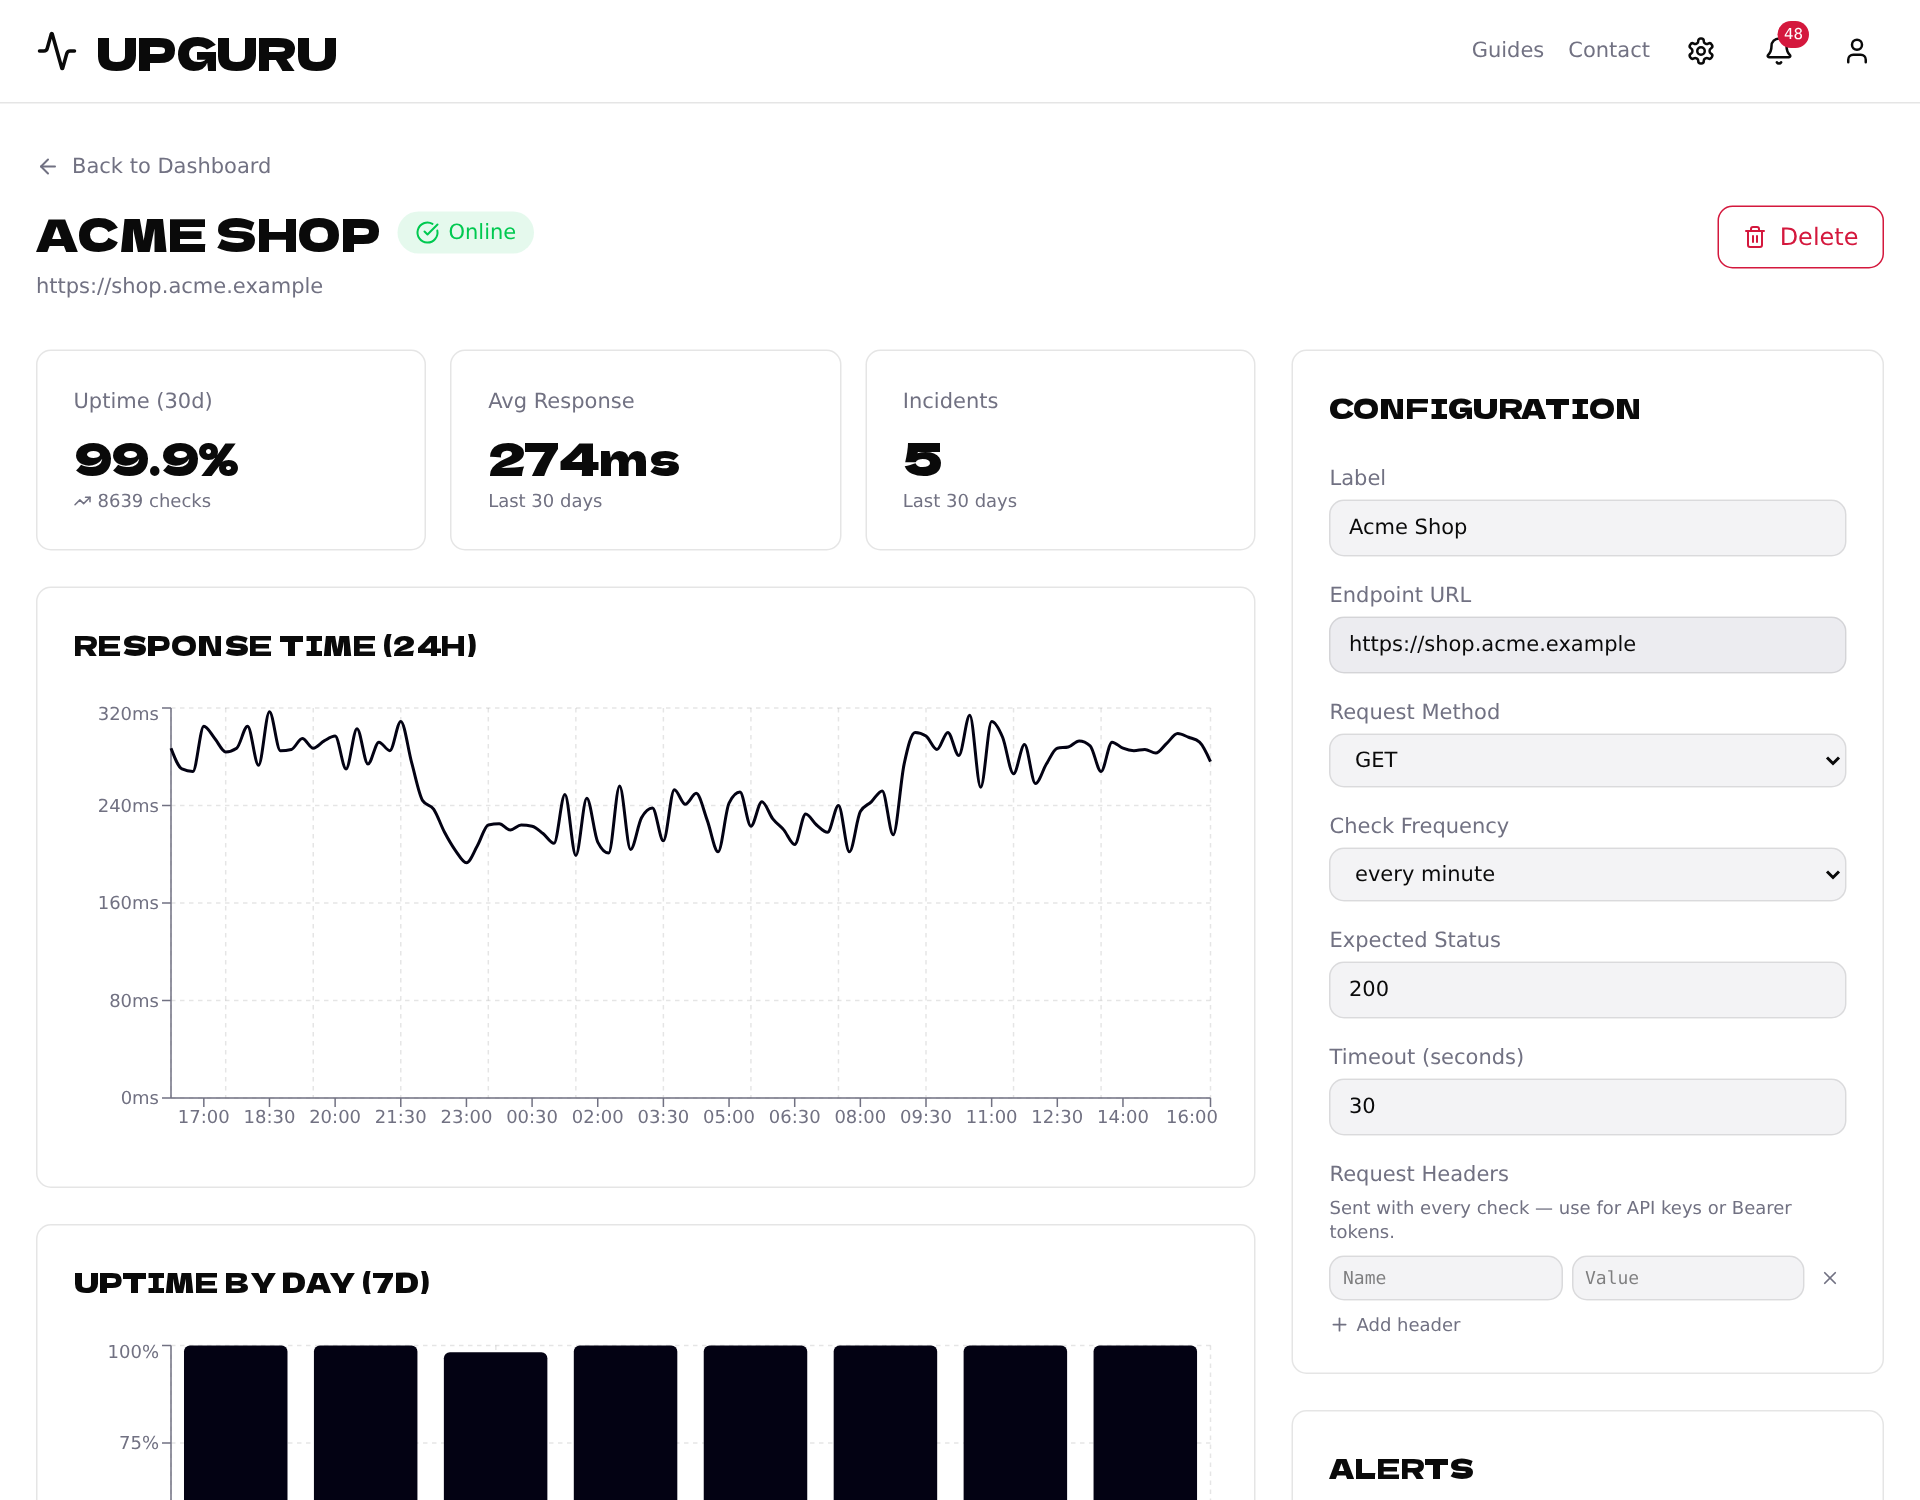
The share of checks that worked. A check works when the site answers with a success code (2xx) or a redirect (3xx). The detail page and the public status page show the last 30 days.
- •99.9% over 30 days means about 43 minutes of problems in a month.
- •99% means about 7 hours.
- •The Uptime by day chart shows each of the last 7 days, so you can see when it happened.
2
Response time
How long your site took to answer. Avg Response is the average over the last 30 days; the Response time (24h) chart shows the last day. A slowly rising line often means trouble is coming before anything breaks.
3
Incidents
Every check that failed. Five incidents in a row usually mean one outage of about five minutes, not five different problems. For cron jobs and apps, an incident is an error they reported or a run that didn't happen in time.
Last Check on the dashboard tells you when we last looked. If it's much older than the check frequency, something is off — here's what to check.